Validation of this multi-method composite reconstruction against the
published Kaufman et al. (2020) Temperature 12k curves
(doi:10.1038/s41597-020-0530-7),
bundled from the NOAA archive under reference_data/published/.
Both curves are anchored to 0 at 100 yr BP (NOAA archival convention) and
metrics computed on absolute anomalies so amplitude and offset
errors are visible — unlike r/CE on recentered series, which hide them.
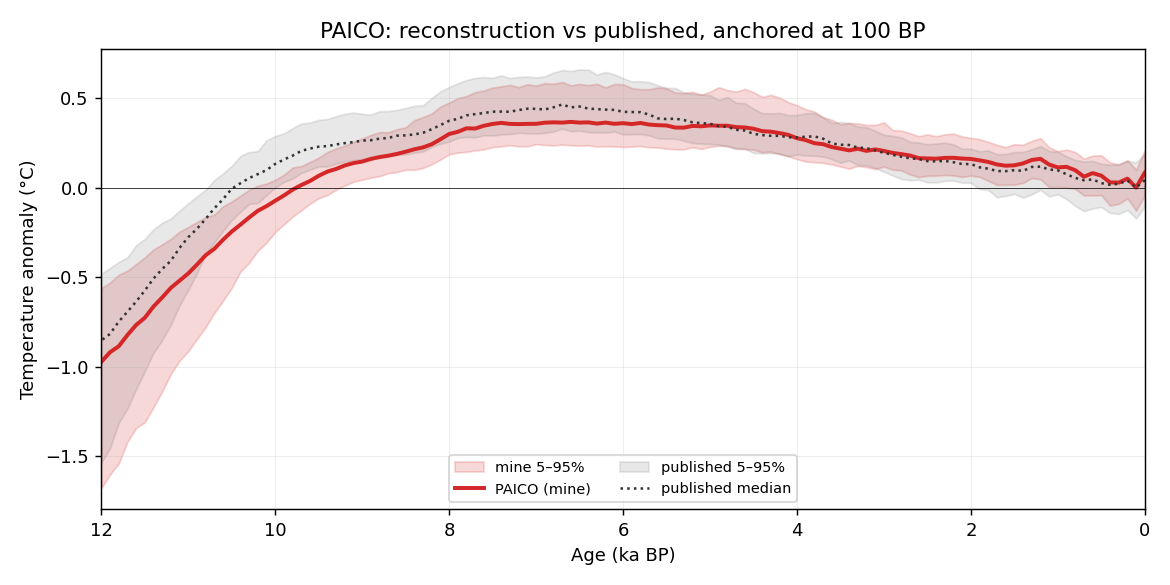
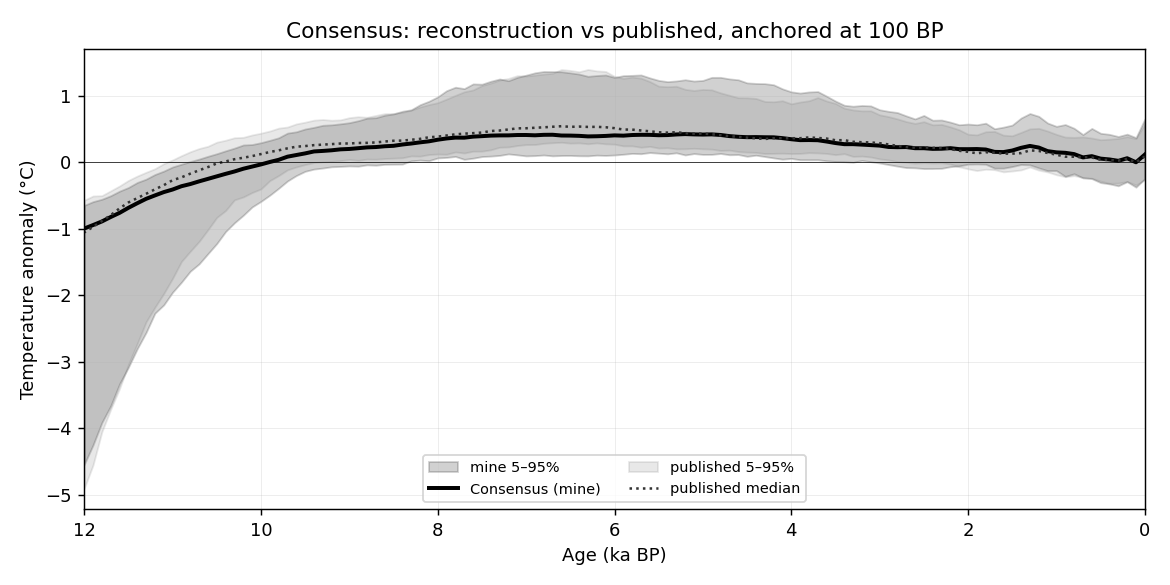
Per-method and consensus comparison against the published curves. Both
anchored to 0 at 100 yr BP. n pts ages 0–12 ka common to both.
r: Pearson correlation of anchored medians.
bias / RMSE / maxΔ: of (mine − published), °C.
amp: std(mine)/std(pub) — 1.0 = matched amplitude.
midHol: mean over 5.5–6.5 ka — mine | published | paper Table 1.
12 ka: mean over 11.5–12 ka — mine | published.
spread: mean(q95−q05) mine/published — 1.0 = matched uncertainty.
flat: longest run of identical consecutive median values (clipping flag).
| Method | r | bias | RMSE | maxΔ | amp | midHol (m | p | T1) | 12 ka (m | p) | spread | flat |
|---|---|---|---|---|---|---|---|---|---|
| SCC | 0.981 | -0.004 | 0.058 | 0.148 | 1.00 | 0.41 | 0.49 | 0.50 | -0.78 | -0.77 | 0.97 | 1 |
| DCC | 0.989 | -0.029 | 0.054 | 0.128 | 0.97 | 0.41 | 0.50 | 0.50 | -0.76 | -0.77 | 0.93 | 1 |
| GAM | 0.954 | -0.157 | 0.174 | 0.316 | 1.04 | 0.23 | 0.45 | 0.44 | -0.81 | -0.70 | 0.90 | 1 |
| CPS | 0.992 | +0.034 | 0.143 | 0.330 | 1.02 | 1.06 | 1.09 | 1.08 | -3.23 | -3.36 | 1.05 | 1 |
| PaiCo | 0.970 | -0.062 | 0.101 | 0.239 | 1.11 | 0.36 | 0.42 | 0.42 | -0.85 | -0.72 | 1.10 | 1 |
| Consensus | 0.980 | -0.051 | 0.082 | 0.195 | 1.00 | 0.40 | 0.51 | 0.70 | -0.85 | -0.83 | 1.12 | 1 |
Reconstruction (coloured line + shaded 5–95% spread) vs published curve (dotted + grey shaded). X-axis: oldest age left, present right.
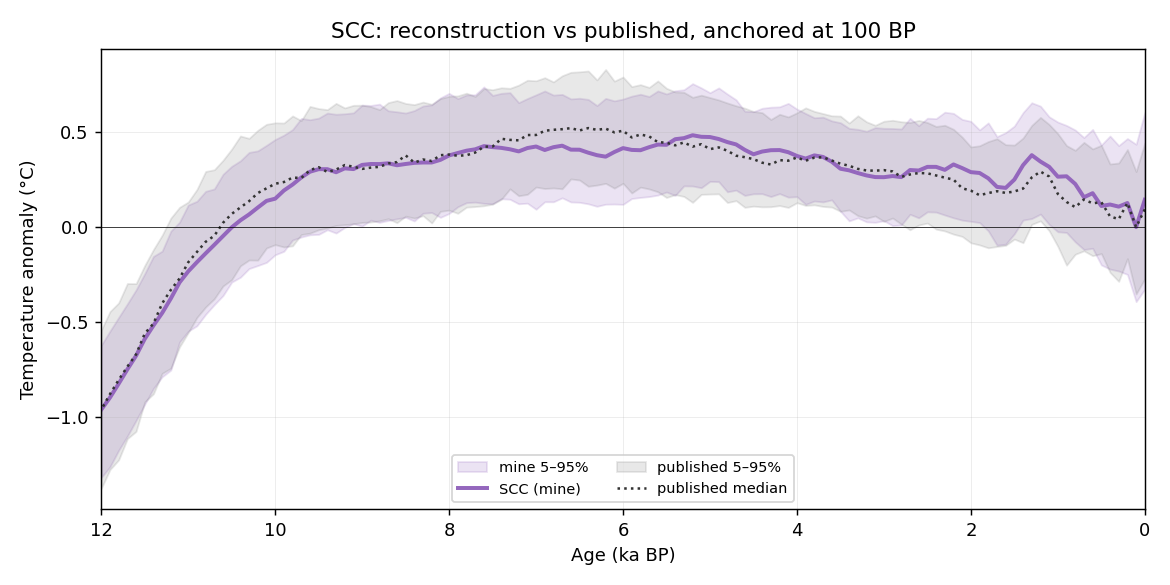
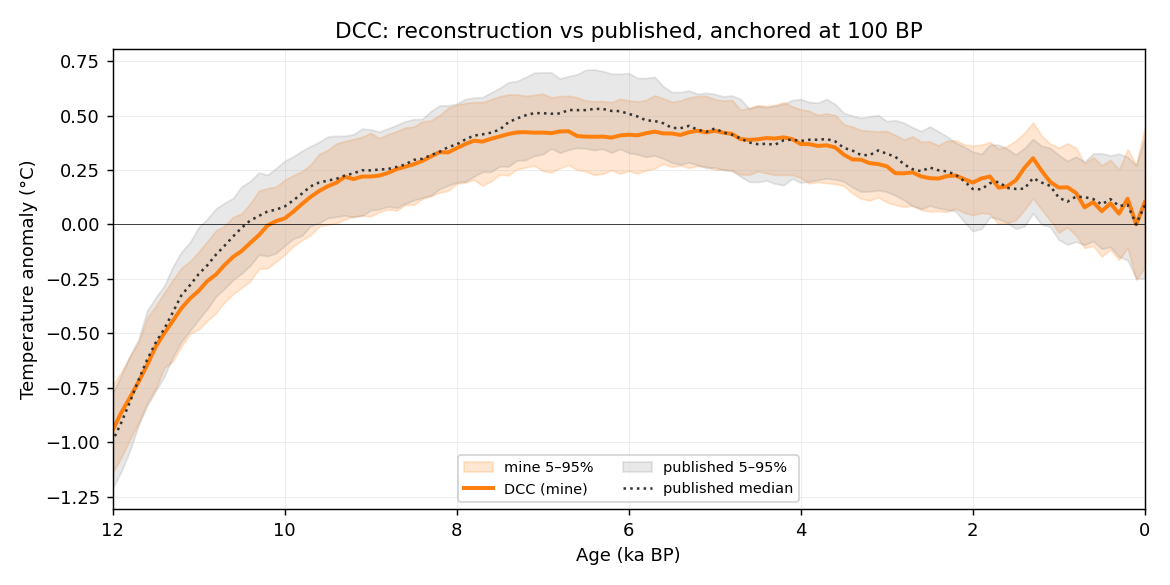
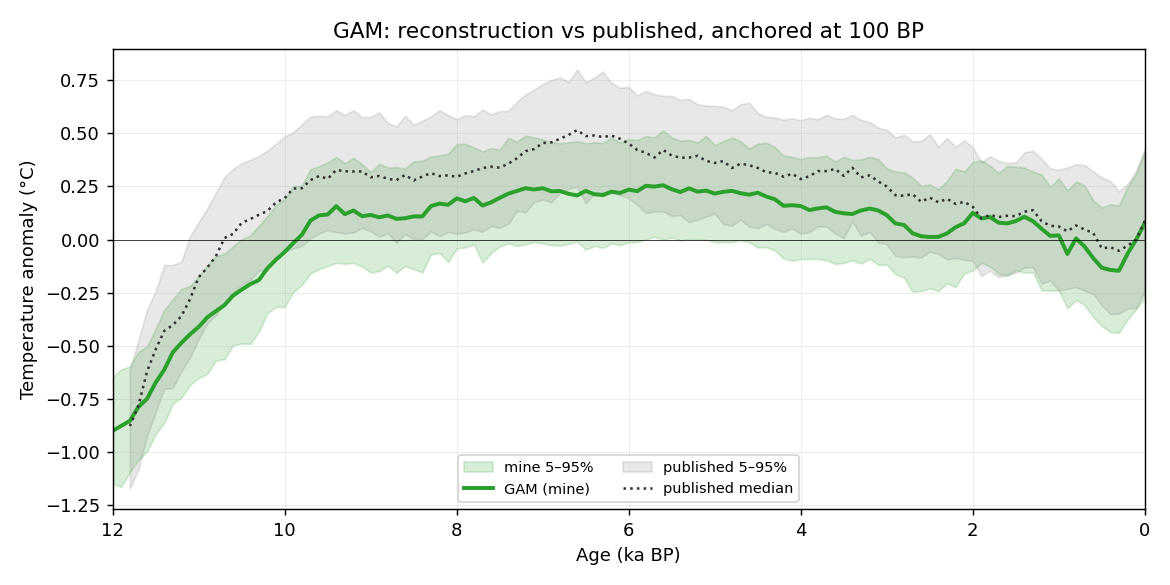
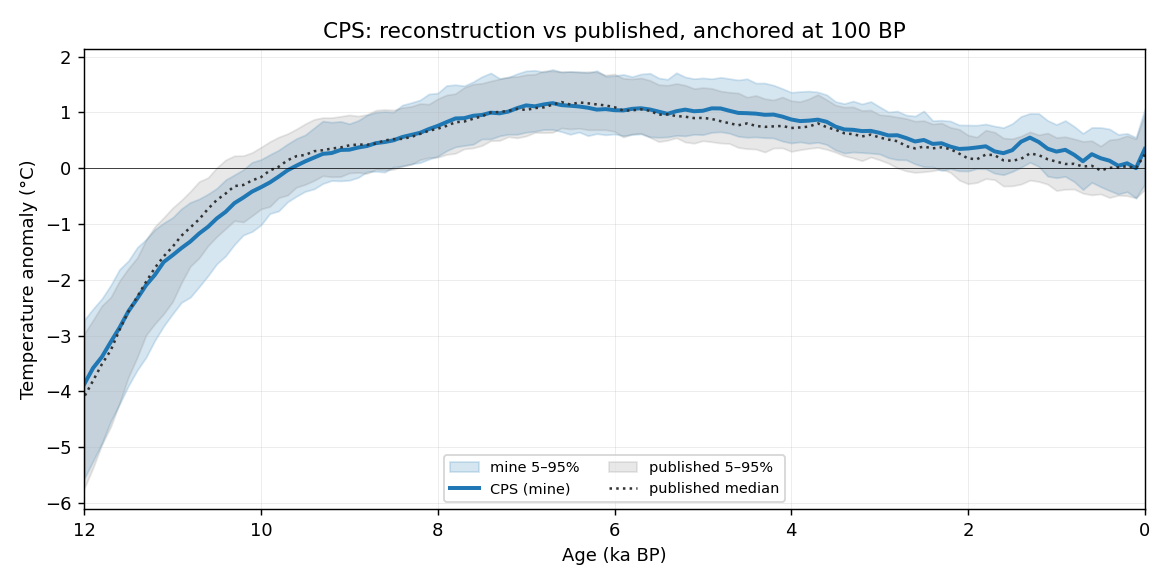
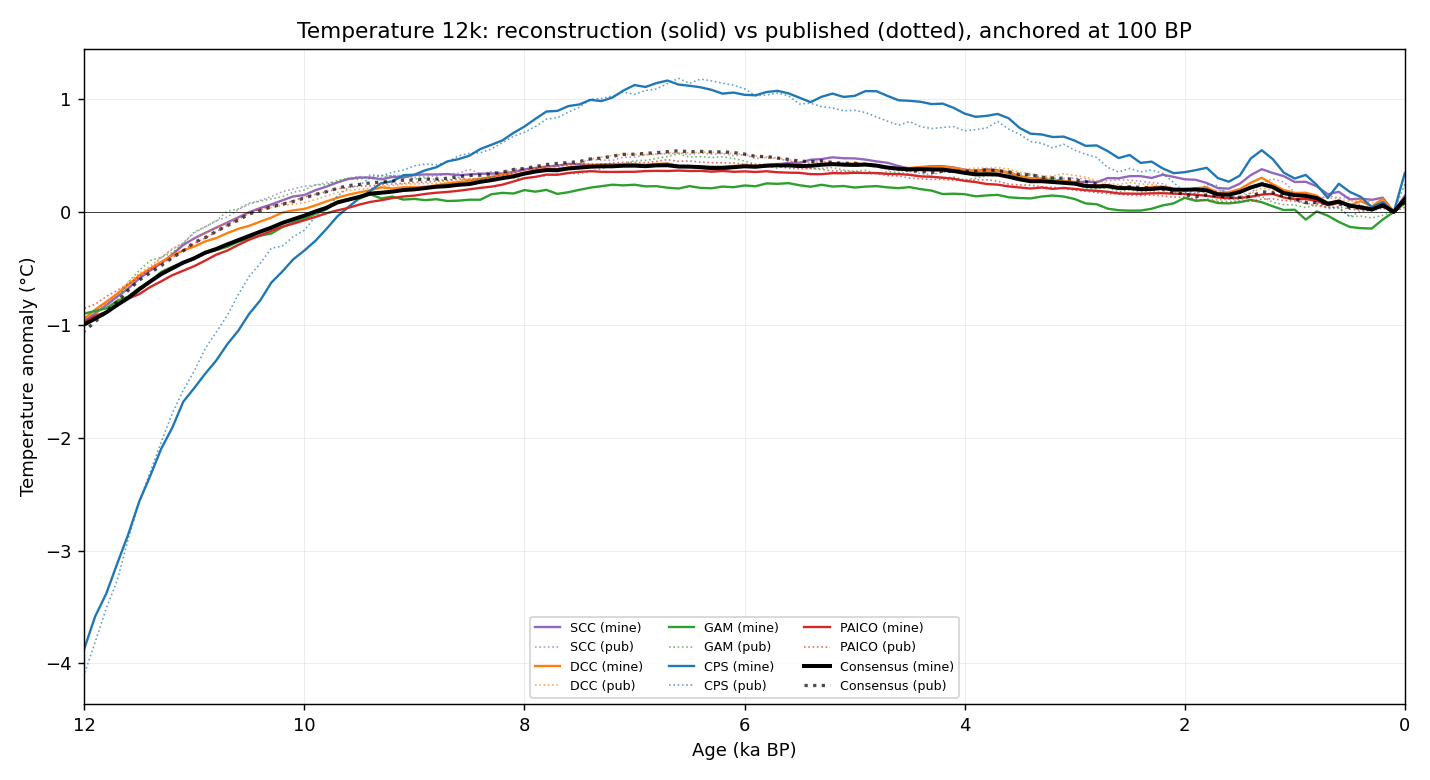
Pooled multi-method ensemble: 2,500 members. Age range in the comparison: 0–12,000 yr BP.